The problem
Public filings hold the warning signs, buried in messy data
Credit teams monitoring hundreds of borrowers can't read every filing. Automating it means solving data problems that quietly break most models.
Tag chaos
One concept, many labels. Revenue alone appears under 8+ XBRL tags across companies and years.
Restatements
The same quarter is reported several times, sometimes with different numbers. Overwrite it and history is lost.
Year-to-date math
10-Qs report cash flow as year-to-date; 10-Ks rarely report Q4 at all. Quarters must be derived.
Future leakage
Using a number before it was public makes back-tests look brilliant and live alerts useless.
Messy borrower lists
Typos, old names, missing or wrong tickers, and subsidiaries that look like their parents.
How it works
From raw filings to an alert an analyst can trust
Batch Python jobs pull public data, clean it into a point-in-time model, and serve it through Supabase with per-tenant security.
Find each borrower
Names and tickers are resolved to SEC companies; anything uncertain goes to a reviewer, never a guess.
Clean the financials
25 standard metrics per company, every value dated to when it became public and traced to its filing.
Rank distress risk
A calibrated LightGBM model scores 12-month bankruptcy risk from ratios, trends, filing behavior and macro conditions, with plain-English drivers.
Review and respond
A watchlist you can rewind to any past quarter, risk signals Claude read from the filings (each with its quote), and “Ask the filings” with citations. Agree/dismiss feedback comes later.
System design
The whole system, in one picture
Six simple steps take public filings and turn them into a risk score you can check. The diagram walks through them one at a time. Pick a step to jump to it.
How it fits together
Data moves left to right. Training happens once, at the top.
Everything uses public data only. Swipe sideways to see the whole diagram on a phone.
Point-in-time financials
Every number, as it was known on the day
A worked example from real data: Hertz's 2020 revenue, the year it filed for Chapter 11.
| Quarter | Revenue ($M) |
|---|---|
| Q4 2019 | 2,326 |
| Q1 2020 | 1,923 |
| Q2 2020 | 832 |
| Q3 2020 | 1,268 |
| Q4 2020 derived | 1,235 |
| FY 2020 | 5,258 |
The 10-K never states Q4. Covenant derives it as full year minus the first nine months: 5,258 − (1,923 + 832 + 1,268) = 1,235.
It is dated honestly. The derived value only exists from the day the 10-K was filed (2021-02-26), so no back-test can see it earlier.
- 2020-11-09 · Q3 10-Q filed: Q1–Q3 known, Q4 unknown
- 2021-02-26 · 10-K filed: FY reported, Q4 derived
- Later filings · each re-report or restatement is a new version; nothing is overwritten
Ordered tag fallback
Per company, period and filing, the best available tag wins, and the chosen tag is stored with the number.
Formula fallbacks
44 active companies report no total-liabilities figure; it is computed from their balance sheet, checked exact in 89% of 16,393 comparable periods.
Quarantine, not silent drops
Non-USD values, impossible dates and 1000× scale slips are set aside with the rule they broke.
Borrower matching
A cascade that knows when to ask a human
Each uploaded row walks down the cascade. The first decisive step sets a confidence score; anything below 0.90 goes to review with the top candidates.
1.000.990.97score / 100≤ 0.75Results so far
Measured, not promised
On real SEC data for a 205-company sample. Each number links to the committed report behind it.
Borrower matching
Auto-matches on a held-out, deliberately messy 100-row file, with 82% of rows matched automatically and every uncertain row sent to review.
Evaluation →Financials rebuilt
Into 25 standard metrics from 50+ tags; core metrics complete for 139 of 179 active companies.
Coverage report →Bankruptcy event scan
Every known Chapter 11 filer in the sample detected in its petition year from 8-K filings.
Spot-check →Adversarial traps
Subsidiaries (Hertz Corp, Ford Motor Credit), namesakes and old brands: none auto-matched to the wrong company.
Test cases →The distress model
Trained on 11,000 SEC filers since 2011; tested on 2022+ data it never saw (78,000 company-quarters, 1.1% default rate).
Better ranking than the classic
PR-AUC 0.098 for LightGBM vs 0.019 for an Altman Z'' baseline (random ≈ 0.011), and ahead in every backtest year 2015–2024.
Model card →Of bankruptcies in the riskiest 10%
Ranked within each quarter, the top tenth of companies held 65% of the next year's bankruptcies (45% in the top 5%).
Results →Median warning time
151 of 211 test-period bankruptcies entered the high-risk tier before filing, a median 14 months ahead.
Lead times →Leakage test
Features recomputed with every later filing, restatement and macro release deleted come out identical; a planted leak is caught in CI.
The test →What the data taught us
Real findings, documented instead of silently patched.
A label you can't take at face value
SEC's bankruptcy tag (8-K Item 1.03) includes mis-tags (AT&T, 2012), sister-company filings and subsidiary-only cases. Each filing's text is now classified before it becomes a label (≈88% precision on a fresh hand-checked sample).
Manual review →A disappearing data series
FRED now serves only 3 years of the high-yield credit spread, too short to train on. It was replaced by Moody's Baa spread, which goes back to 1986.
Thousands vs. units
Early-XBRL filings (e.g. TrueBlue, TTEC) reported values 1,000× too small. They're caught by comparing to stable neighboring quarters.
…but not every jump is an error
BioCardia's reverse merger looked like a scale slip and was a genuine restatement. The rule was tightened so real history isn't thrown away.
Analyst console live
A watchlist you can rewind in time
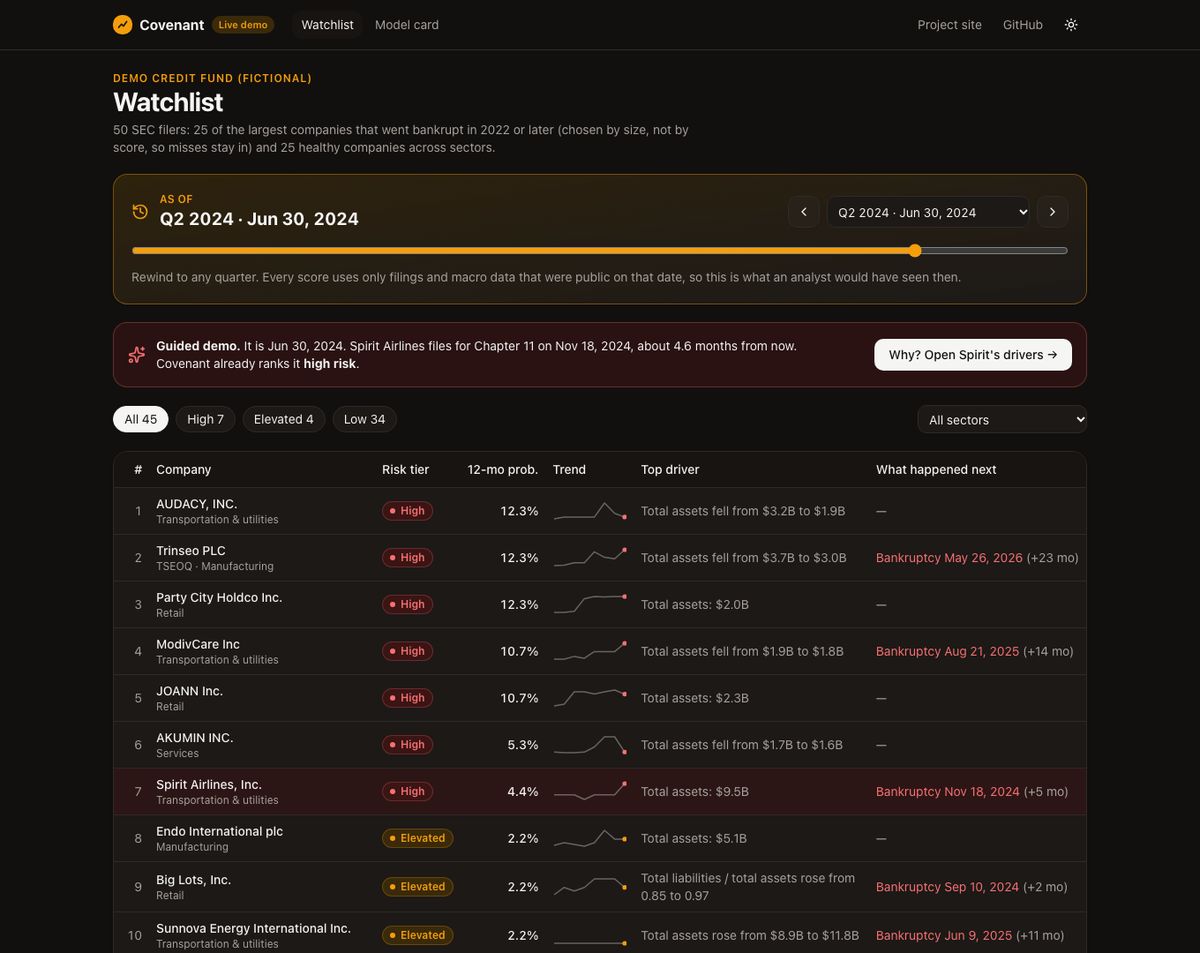
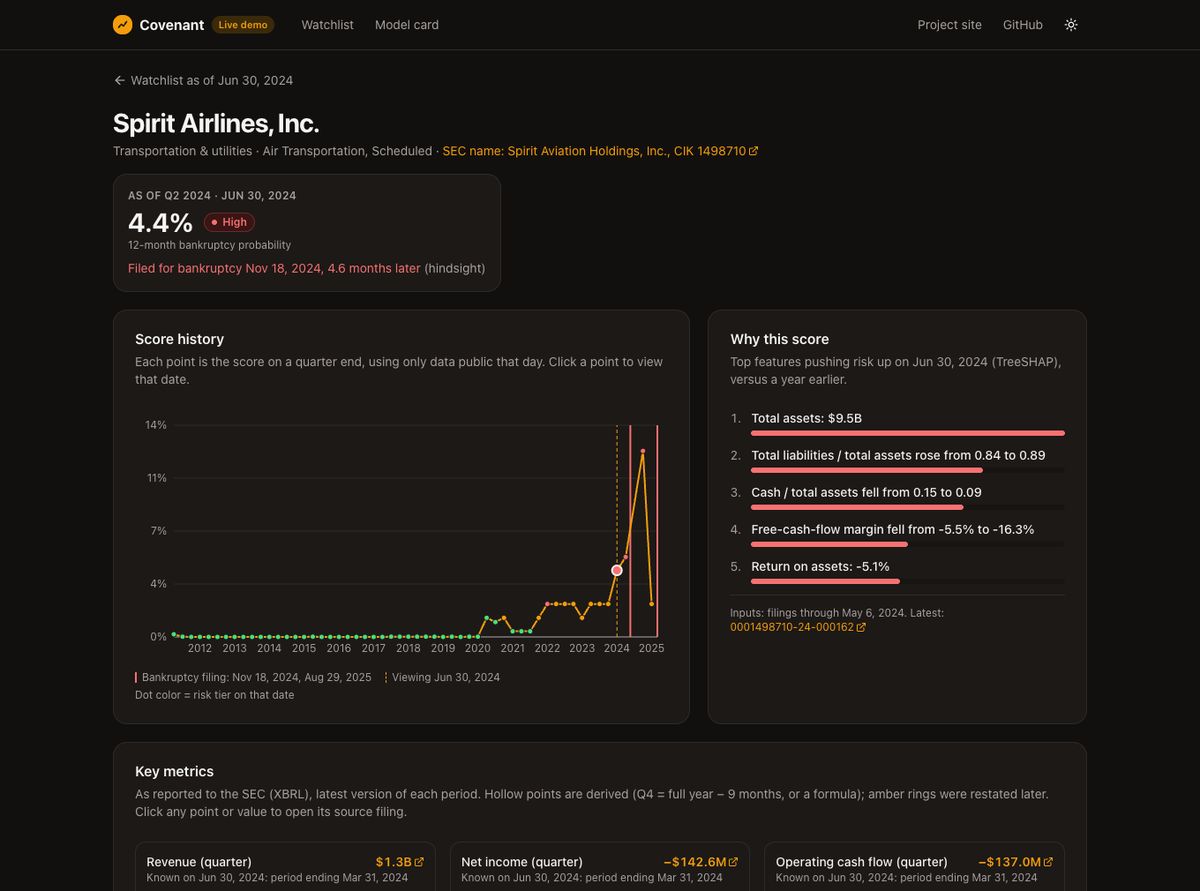
The app a credit analyst would use. It is live: try the demo, no sign-up needed. It opens on June 30, 2024, five months before Spirit Airlines went bankrupt.
Go back in time
Pick any quarter since 2011. Every score uses only the filings that existed on that day, so you see what an analyst could really have known.
See the reasons
Each score shows its top 5 reasons in plain words, like "cash fell" or "debt rose", next to a chart of the score over time.
AI reads the filings
Claude reads each company’s risk factors, management discussion and auditor’s report and flags five warning signs, like going-concern doubt or a covenant waiver. Every flag shows the exact sentence; if that sentence isn’t really in the filing, the flag is thrown out.
Ask the filings
Ask a question about a company and get an answer built only from its filings up to the date you’re viewing, with quotes and links. If the filings don’t say, it tells you so instead of guessing.
Check every number
Key numbers link to the exact SEC filing they came from. Numbers that were worked out or later corrected are marked.
Open, but read-only
Anyone can try the demo without signing up. Visitors can look but never change anything or see another lender's data, and 19 tests check that.
Stays up to date
Every Monday a robot downloads the latest filings for the 50 companies and scores them again.
Honest demo list
25 large companies that went bankrupt since 2022, picked by size, not by score, so the misses show too. Plus 25 healthy ones.
Engineering
Built so the numbers can be trusted
The guarantees that matter for a risk product are enforced by the database and checked on every change.
No future leakage
Features read data only through an as-of query; a database check rejects any snapshot built from later filings.
Tenant isolation
Postgres row-level security on every customer table, with tests proving one lender can never read another's data.
History is append-only
Metrics, predictions, feedback and audit logs reject updates, deletes and truncation at the database level.
Safe to re-run
Every job is idempotent; a full rebuild followed by a second run adds zero rows.
281 tests in CI
Lint, strict type checks and tests on every pull request, a full build of the web app, plus migrations applied to a real Supabase database.
CI runs →Config, not code
Tag mappings, event codes, sector exclusions and model names live in versioned config.
Roadmap
Seven phases shipped, and the demo is live
Each phase ships with acceptance tests before the next one starts.
| Phase | Status |
|---|---|
| 0 · Foundations | Done |
| 1 · Ingestion | Done |
| 2 · Canonical model | Done |
| 3 · Entity resolution | Done |
| 4 · Models | Done |
| 6a · Console + demo | Done |
| 5 · AI signals | Done |
| 6b · Full app | Next |
| 7 · Hosting | Planned |
Follow the build
The source, specs and every evaluation report are public.